


Implementation and Adaptation Guide
Home | Table of Contents | Pre-Implementation | Implementation | Sustainment | Resources | Glossary | Contact Us

Evaluating and Summarizing Impact and Effectiveness
To evaluate the impact and effectiveness of your program, you need an overall evaluation plan that is:
❯ Established prior to delivering your program;
❯ Feasible, yet meets priorities of all key stakeholders; and
❯ Captures the “story” of what happened during your implementation, including adaptations made and lessons learned.
Evaluation Questions
Your evaluation should answer these important questions:
- What was the key need or gap this program was designed to address? How successful was it in closing this gap?
- What were most important outcome(s)? Describe results on these and provide an example, using both quantitative and qualitative data (including quotes and stories).
- What are the effects on other outcomes and unanticipated effects? Describe any surprises and any impact on other priority areas.
- What are the results over time and the effects of any adaptations made?
- What are the lessons learned during program delivery?
- What were the costs and budget impact, from multiple perspectives? This needs to be presented in a way that addresses priorities of and what leadership considers key values and priorities.
A table is a great way to summarize your evaluation results. Below is an example table summarizing findings from another project.

| Issue | Summary of Results Regarding Issue |
|---|---|
| Key Gap | Losing patients after discharge from community hospital. Failure to connect Veterans with PACT teams |
| Most important outcomes (from Stakeholders) | Effectiveness (percent and types of Veterans connected to PACT team) The percent of released Veterans increased from 35% at baseline to 78% at our latest assessment as of XX/YY/202X. Veterans who had an established PACT team prior to hospitalization and who were hospitalized longer were more likely to be connected. Implementation (consistency across staff and settings in delivering the program and adaptations made) Transition nurses were able to make connections to local PACT teams, but nurses that had longer pre-existing connections to the hospital staff – and those working with hospital B had higher connection rates. |
| Other Effects, including any unintended effects | Follow-up Veteran satisfaction ratings increased over time among those hospitalized during and after the program. |
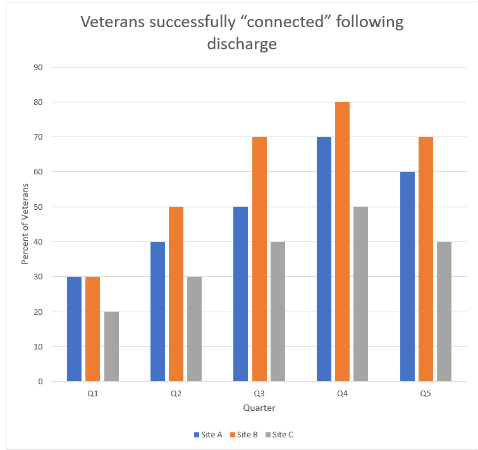
| Results over time (and over setting or staff as appropriate) | Rate of successful connections increased over the first three quarters, then leveled off and decreased slightly in the most recent quarter. Hospital B improved their success rate the most, and Hospital C improved the least. |
| Key Lessons Learned | Hospital transitions to local PACTs can be facilitated by a relatively straightforward program coordinated by a transition nurse with brief training and ongoing support, but boosters or other maintenance activities may be necessary. |
A couple comments on the example above:
- We used the RE-AIM framework described in Framework for Progress Tracking to evaluate results, but note that using RE-AIM pragmatically as recommended by Glasgow and Estabrooks (2018), we did not comprehensively assess all five of the RE-AIM dimensions, but the two that our stakeholder team felt were most important.
- We included both objective data and results when we could collect such data, but also qualitative data, impressions, and our lessons learned to help interpret results.
- When you have both objective and subjective data, we recommend you present the quantitative data first, followed by qualitative data and information from key “informants” staff and Veterans, and then your conclusions and lessons learned.
Create Your Own Evaluation Summary
Here is a template for creating your own summary table. You should adapt it to your specific project, setting, and priorities of your team and stakeholders. Download this worksheet to create your own Evaluation Summary.
Displaying Your Results
It also helps to have a couple visuals that can concisely show the key results from your project, such as a figure, graph, or table. Below we provide an example summary bar chart figure that shows the percent of Veterans successfully “connected” following discharge by quarter of the program and by each of the three participating hospitals regions. Remember that whenever possible the type of results display that stakeholders would like to see should be identified with them during the planning stage of your program.
Previous: Sustainment Phase / Next: Adaptations In Later Stages For Sustainment and Scale Out


